With the Competitor Monitoring tool in the Traffic & Market Toolkit, you can track competitor activity across the web. Add competitors to your Traffic & Market list, then open a single-domain report to review activity for the selected competitor.
The tool tracks competitor activity and sends updates about:
- Newly published blog posts
- Recently launched Google Search Ads
- New pages across competitor websites
- New Facebook and Instagram posts
- Social engagement trends
Use Competitor Monitoring to uncover shifts in competitor strategy, messaging, campaigns, and market activity. Tracking new pages, blog posts, Google Search Ads, social media activities can help you:
- Reveal upcoming product launches
- Pinpoint new landing pages and promos
- Uncover shifts in audience targeting
- Spot campaign and content trends faster
- Understand how competitors are positioning themselves in the market
Why should I use this tool
Keeping track of competitor activity online can be overwhelming. Competitor Monitoring brings key updates into one Traffic & Market workspace, making it easy to keep up with shifting strategies, campaigns, and releases.
Once your competitors are added to a Traffic & Market list, Competitor Monitoring collects activity for each domain. You can open a single-domain report to review updates, check activity trends, and investigate the specific pages, ads, blog posts, and social posts behind those changes.
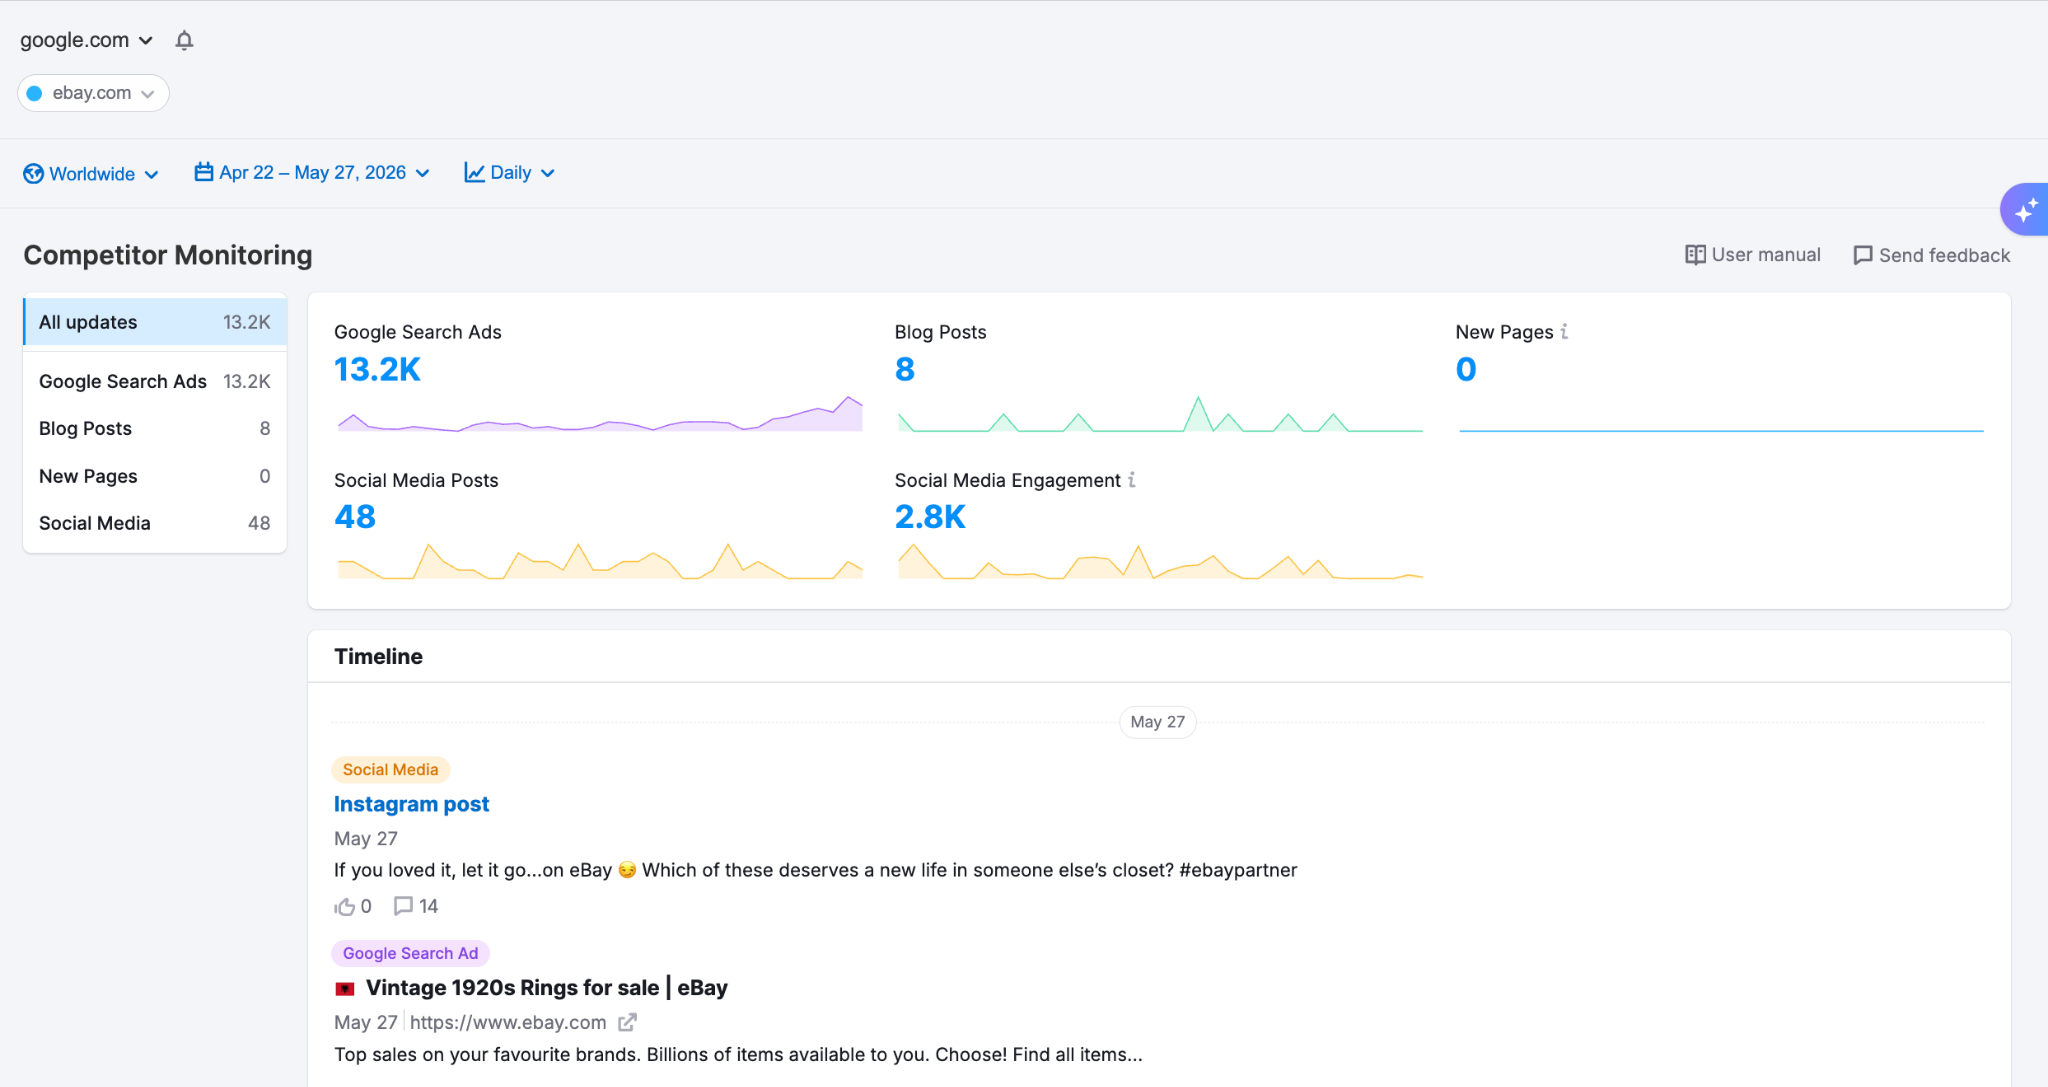
The Competitor Monitoring dashboard includes trend graphs, timelines, and links to original sources. You can filter by category and group activity by day, week, or month. Timeline items include sample text and useful links, so you can dig deeper into specific ads, new pages, blog posts, and social posts.
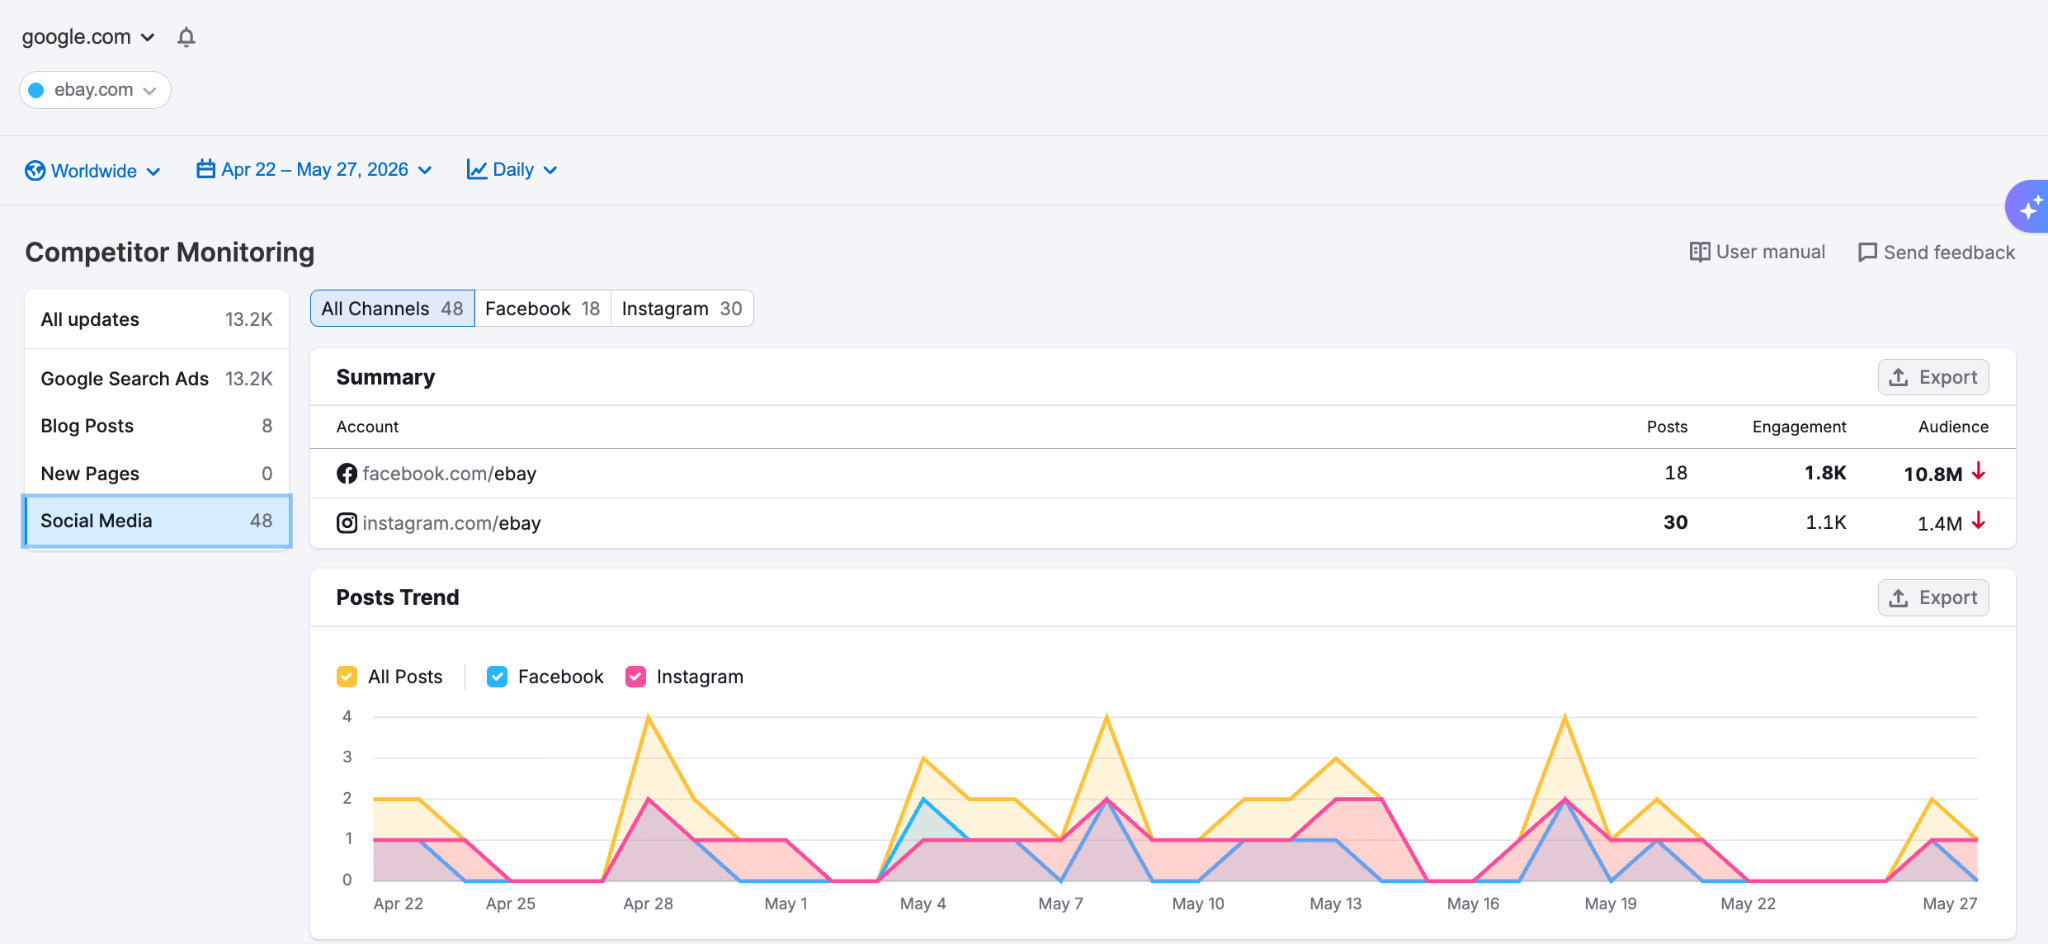
The weekly email updates and Competitor Monitoring dashboard offer a simple way to keep up with competitors’ online activity. Timely intel about competitors can help you keep an edge in the market and swiftly respond to shifting trends. The export function allows you to share data with others in Google Sheets and via CSV files.
Feel free to review all data Competitor Monitoring offers in a free sample report available either from the main page of the tool or via this link.
Note: the list of sample domains and the date range are fixed. However, you can create a personal list from the sample report to edit it.
Getting Started with Competitor Monitoring
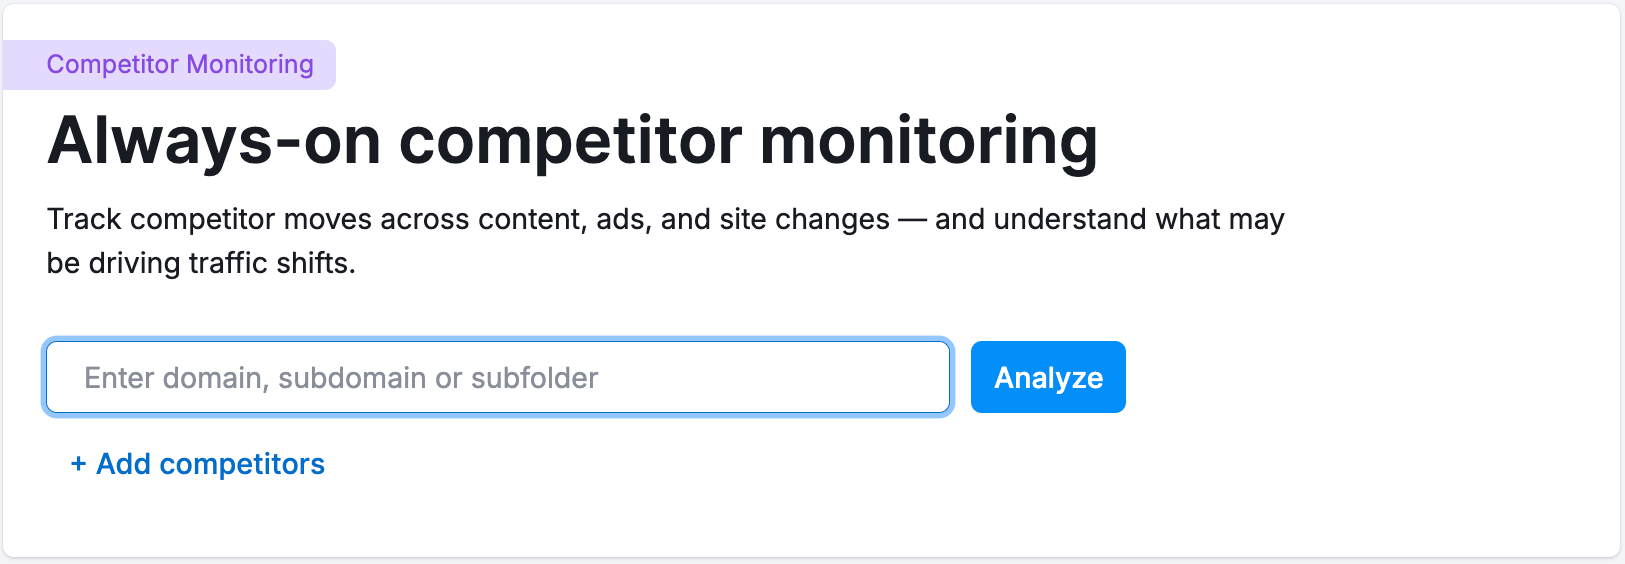
Setting up your Competitor Monitoring dashboard starts in your Traffic & Market list settings. Once you’ve entered your competitors, click the “Analyze” button to the right of the list.
When you reach the Competitor Monitoring dashboard, click the bell icon in the upper left-hand corner of the page.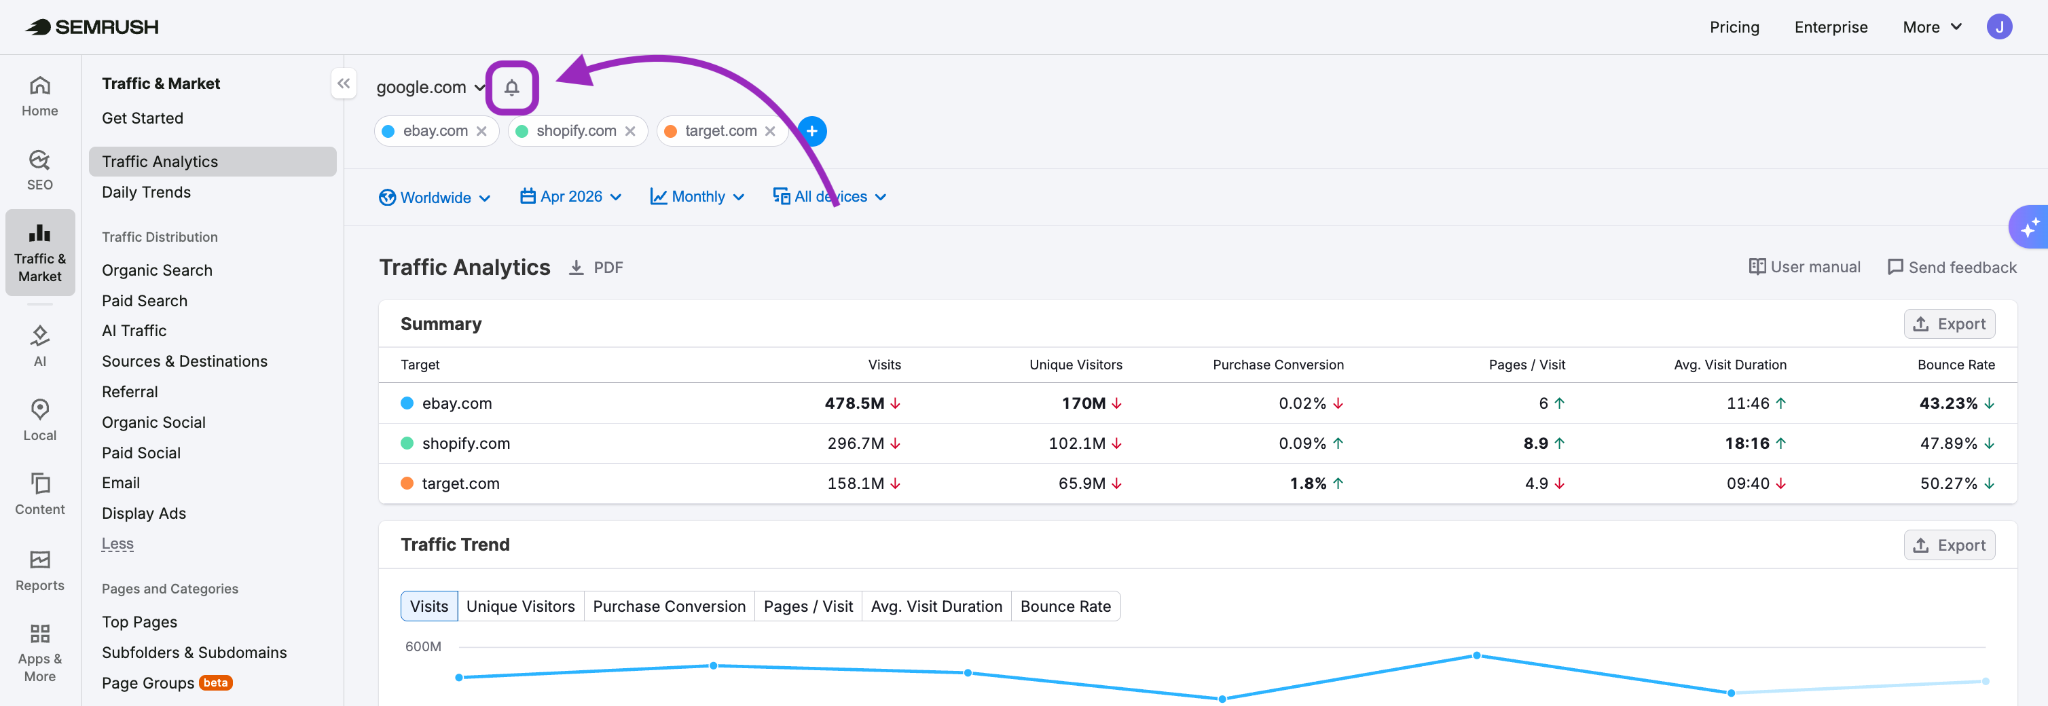
This button will open the settings window where you can adjust your competitor list, page groups, social media tracking, and notification settings.
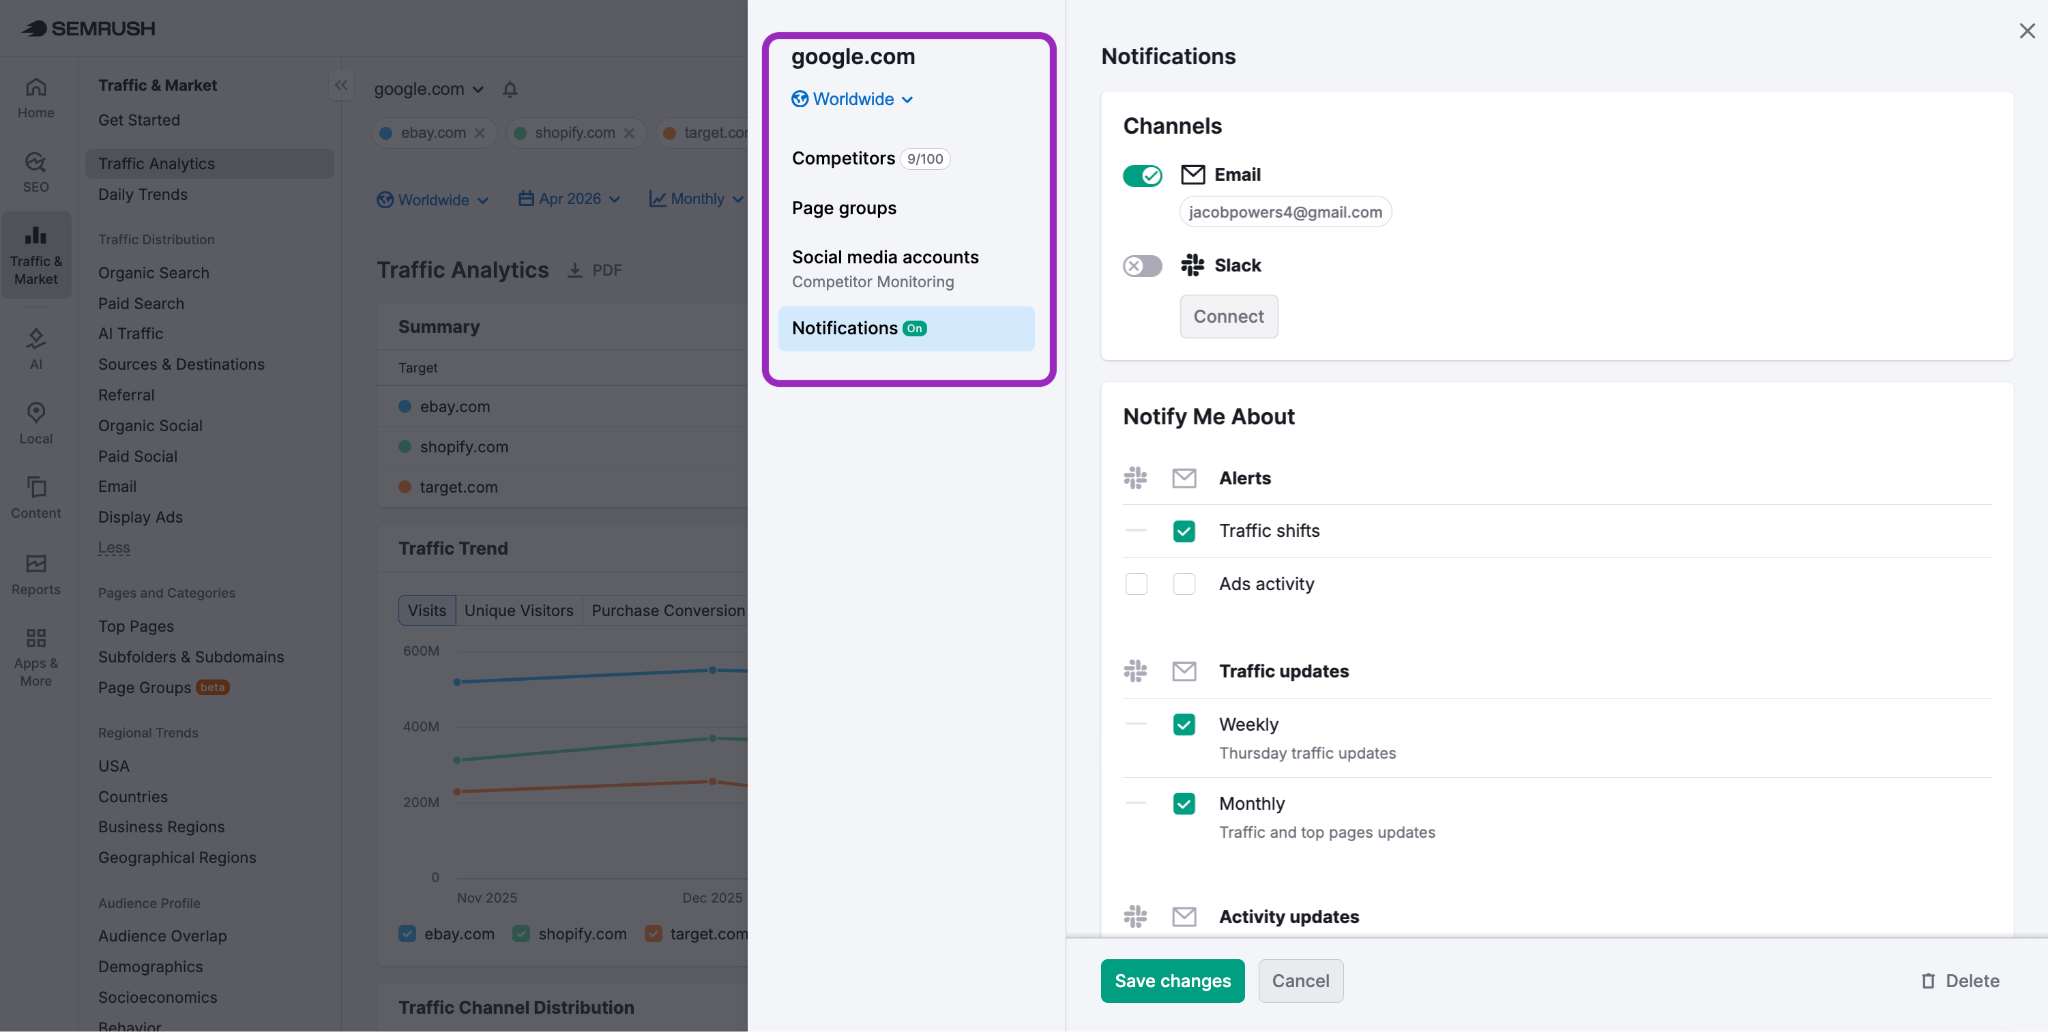
The notification settings allow you to subscribe or unsubscribe from weekly email and Slack notifications, which are sent to the provided email addresses and the connected Slack account.
If sharing the email report with another Semrush user, the user will be able to access the report simply by clicking the links in the related email.
The report settings allow you to choose whether to receive weekly competitor updates and/or ads activity alerts. You may then select target countries for your weekly email notifications. This can be helpful if you want to receive updates only in your target countries.
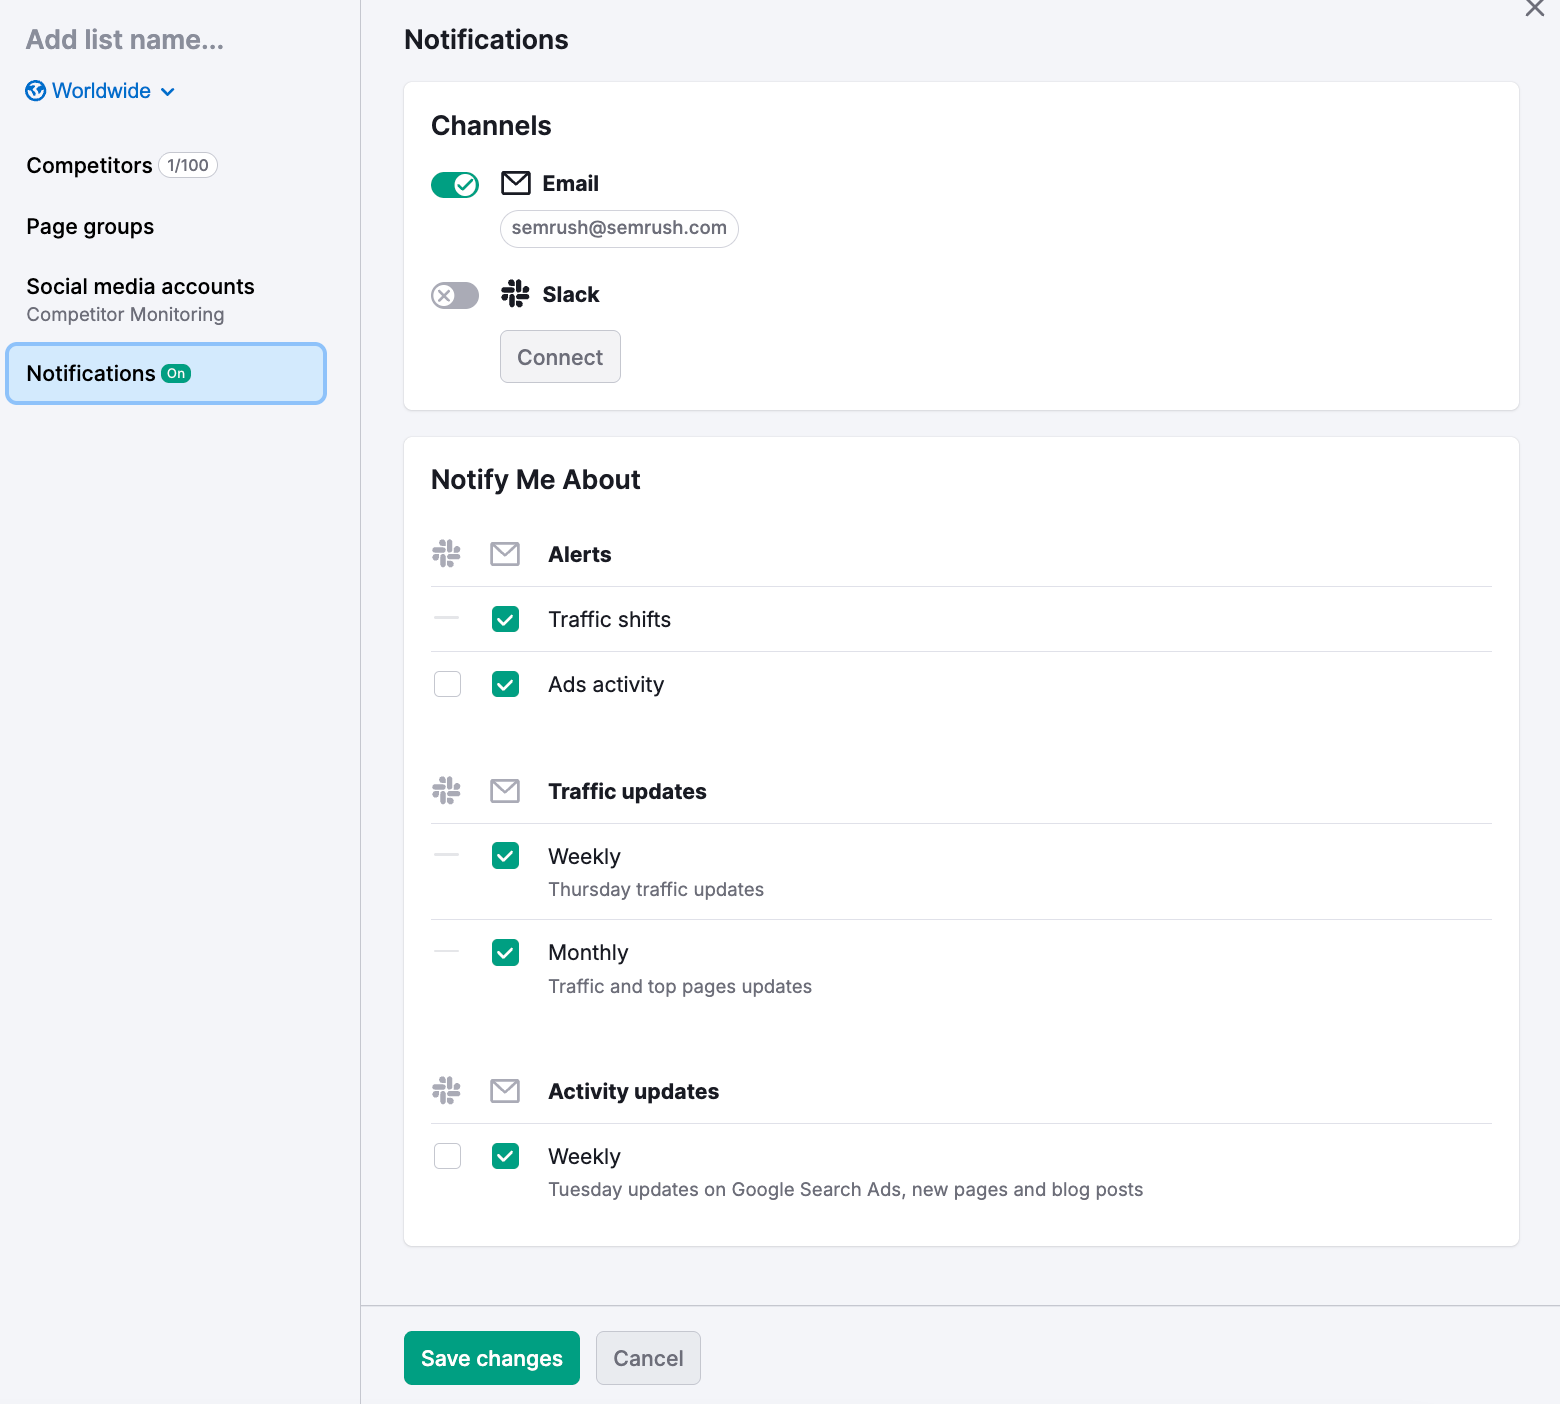
You can also integrate Slack to receive these notifications directly to your Slack. Choose the types of notifications you would like to receive, and you will then receive a welcome message.
Social Media is not set up by default, so you must manually add links to the profiles you want to track. At the moment, only Facebook and Instagram accounts can be added.
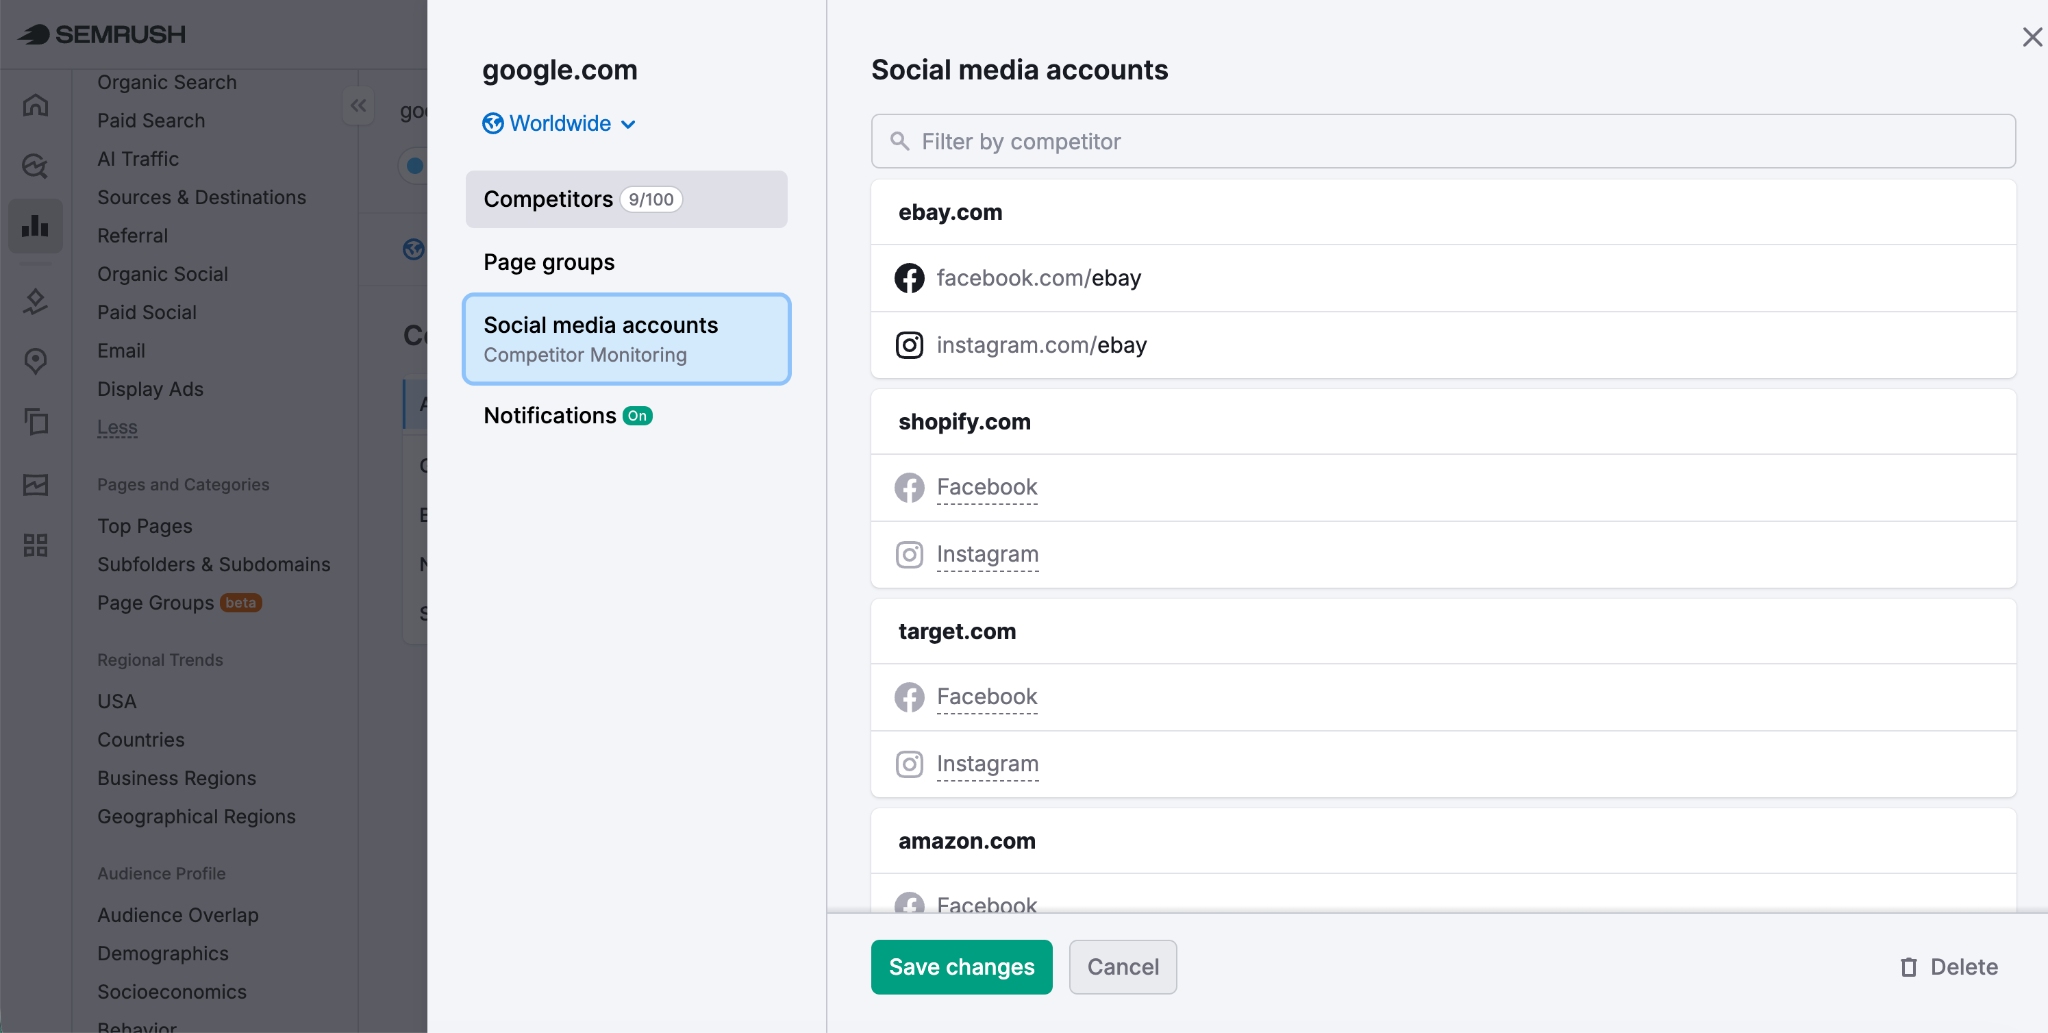
Keep in mind that when adding a site for the first time, the tool may need up to 72 hours to gather the initial set of data for your dashboard.
Competitor Monitoring Report
Competitor Monitoring shows updates for one selected competitor at a time, including Google Search Ads, blog posts, new pages, and social media activity.
Use the left-side report menu to switch between update types. Each section gives you a focused view of that competitor’s activity for the selected country, date range, grouping, and device type.
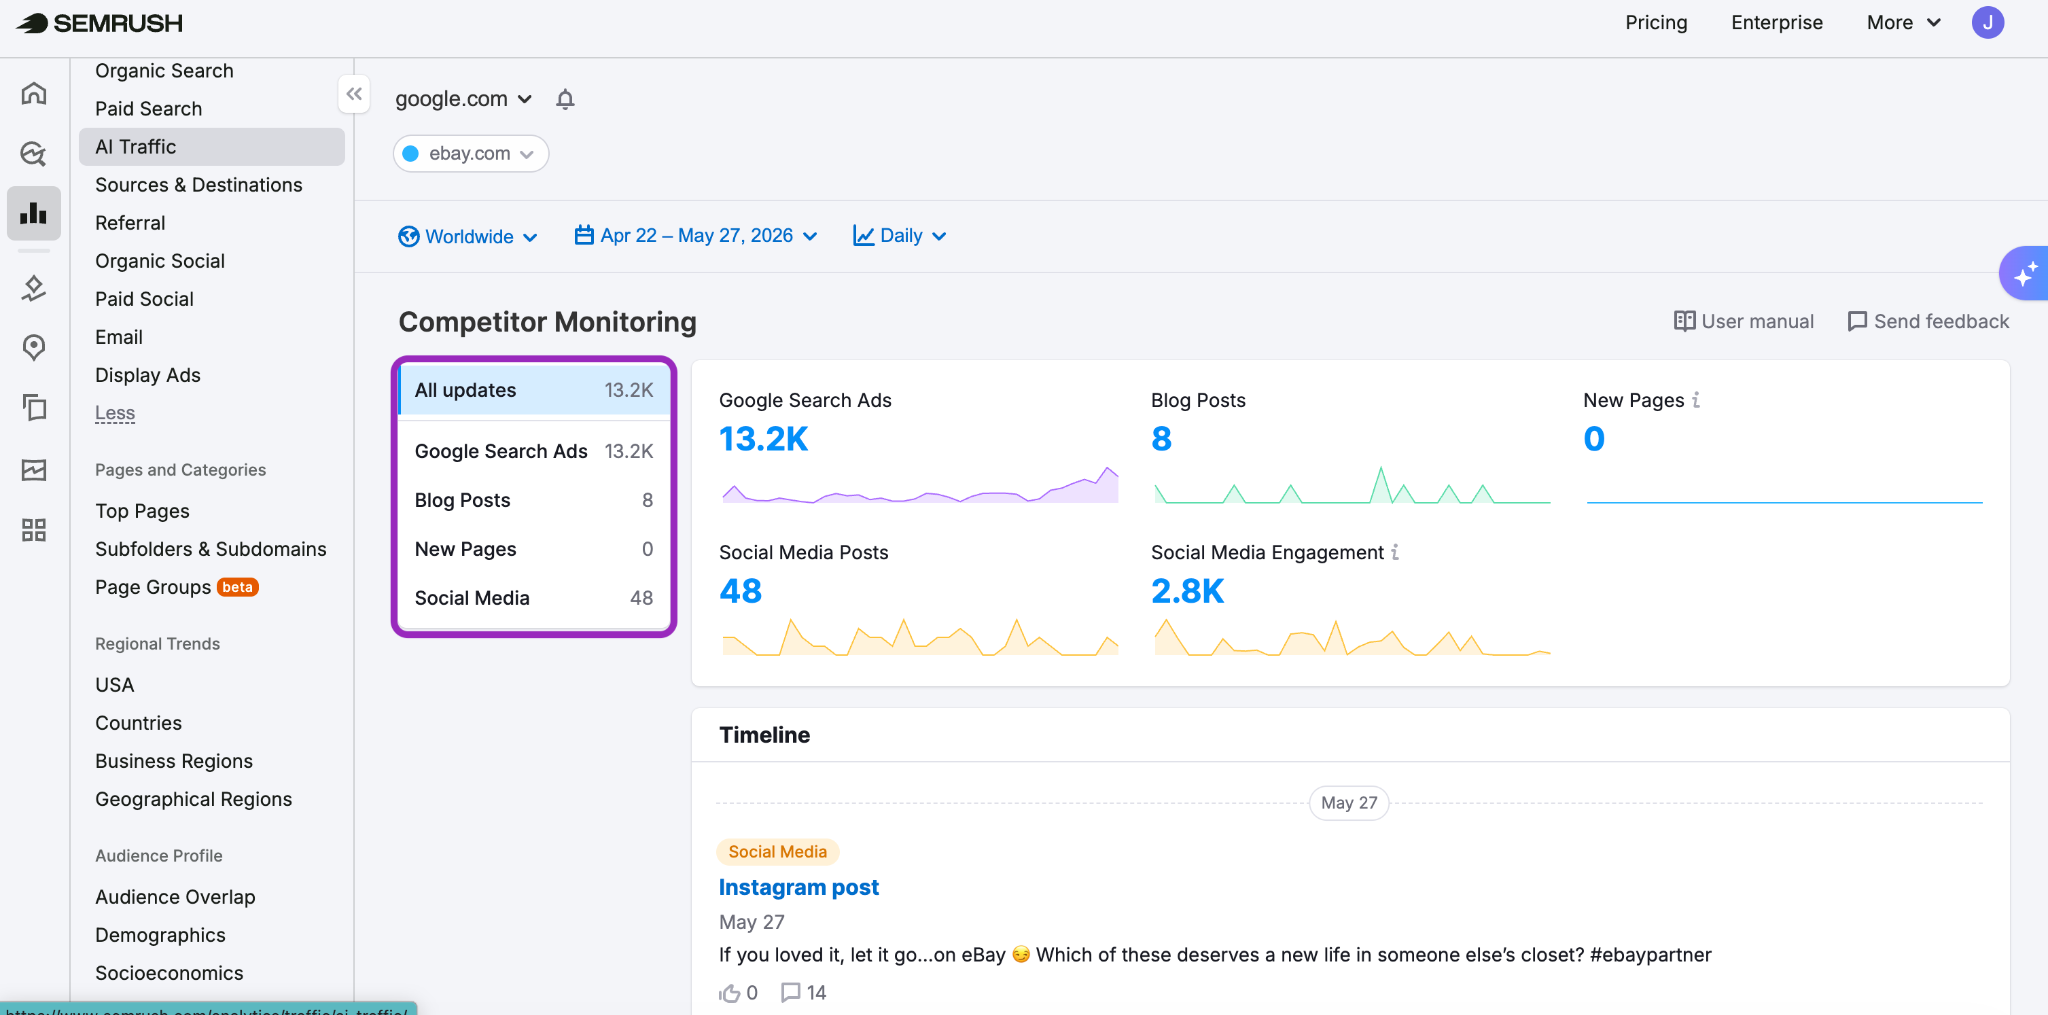
For Social Media, you can review Facebook and Instagram activity, including post counts, engagement, audience data, and post trends over time. Use the channel tabs to view all social updates or filter by Facebook or Instagram.
You can move between your different lists at the top of the dashboard. Each of your lists can have different settings, such as country tracking and a list of recipients.
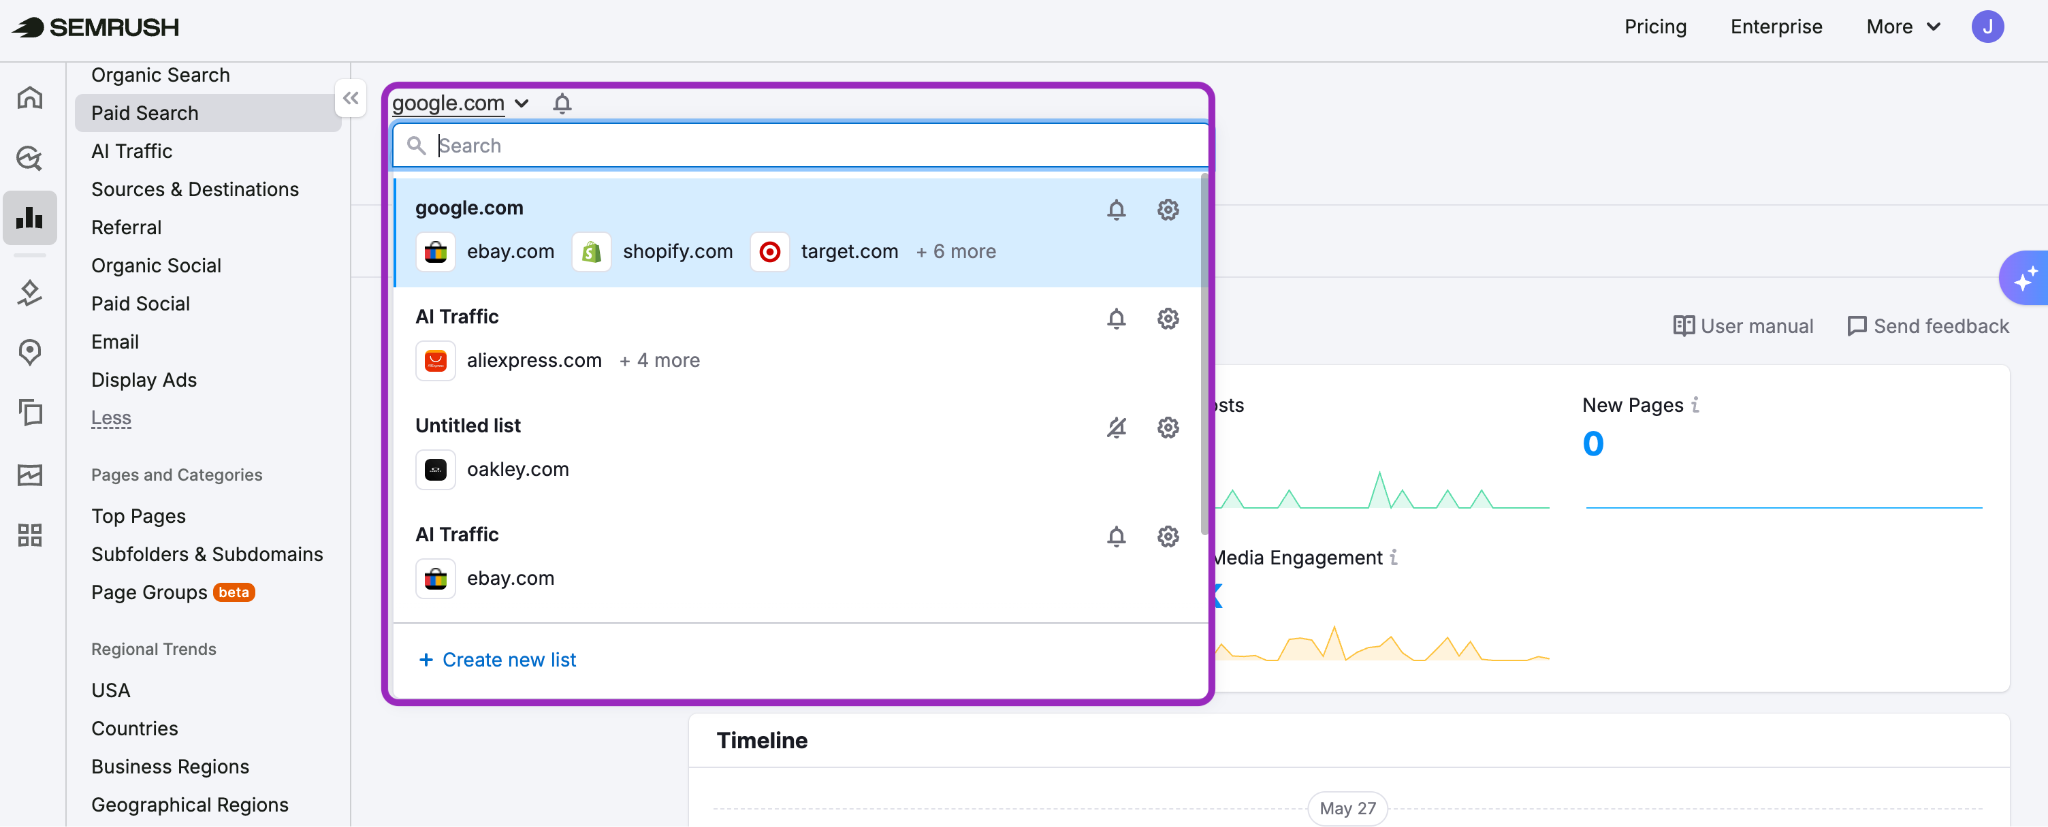
At the top of the page, you can change the date range to view ads, new pages, engagement numbers, social media, and blog posts published across various time frames.

You can also select a country you’d like to examine.

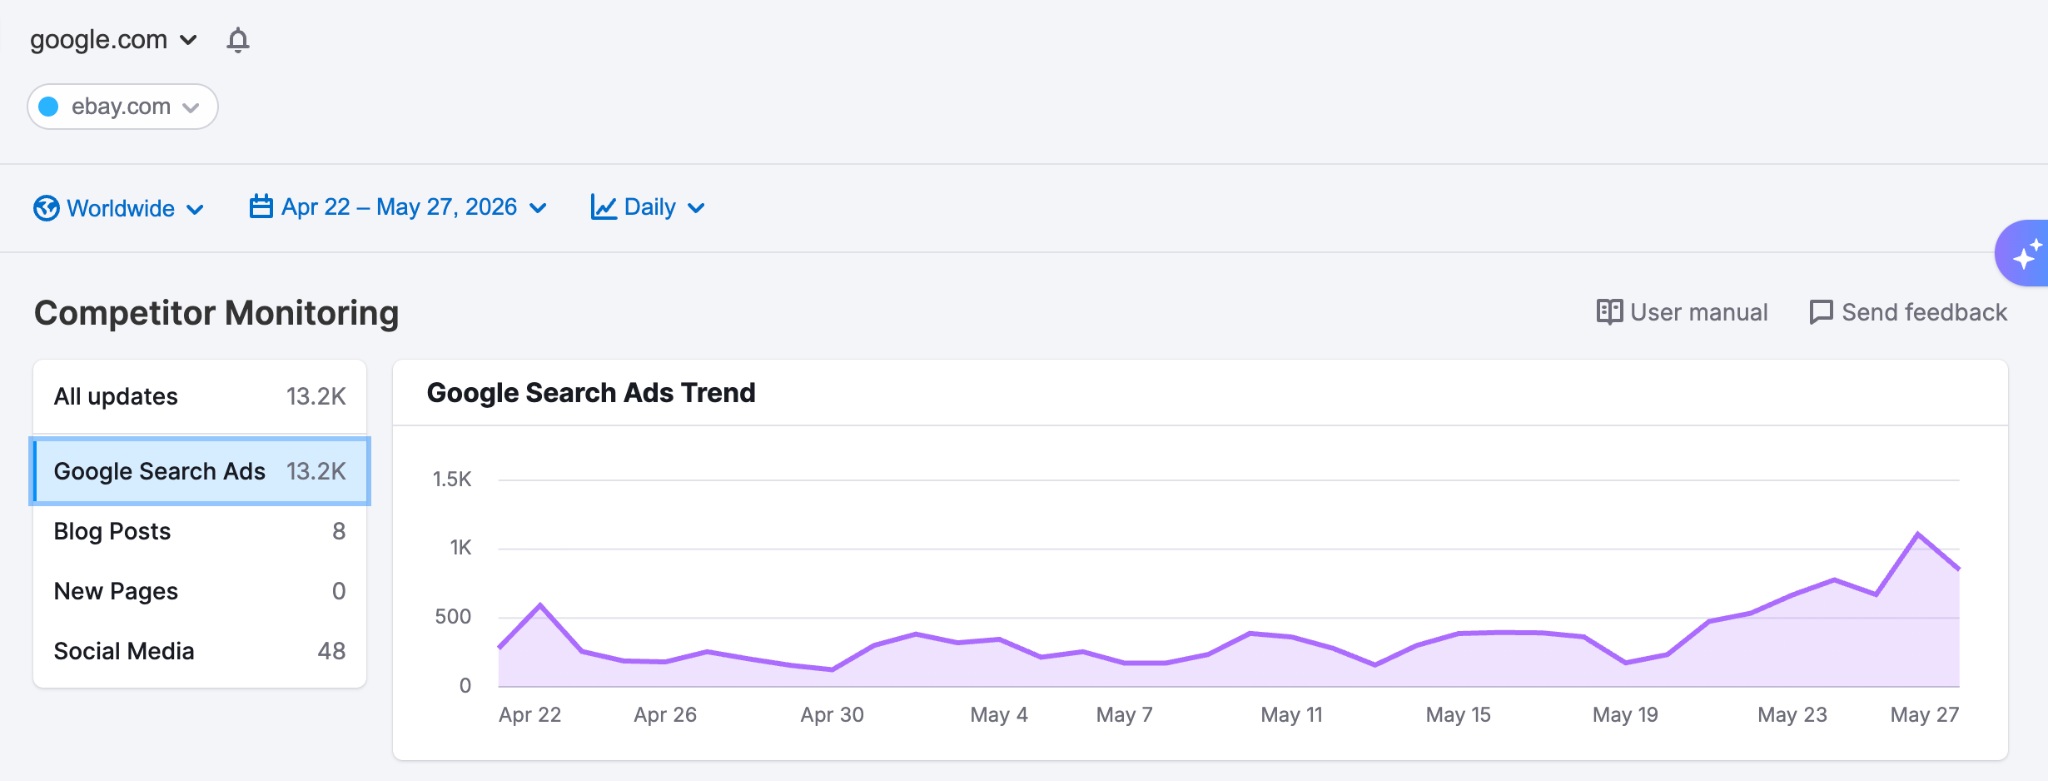
Once you’ve selected a competitor, a date range, and a location, you can adjust the trend graph to depict the data you’re looking for. You have the option to:
- Filter the chart by the tabs to show All Updates, only Google Search Ads, only Blog Posts, only New Pages, or only Social Media
- Group the data by Day, Week, or Month

Depending on the selected filter and grouping, the graph presents the trend in data. You can also hover over a point on the graph to view a breakdown of the numbers.
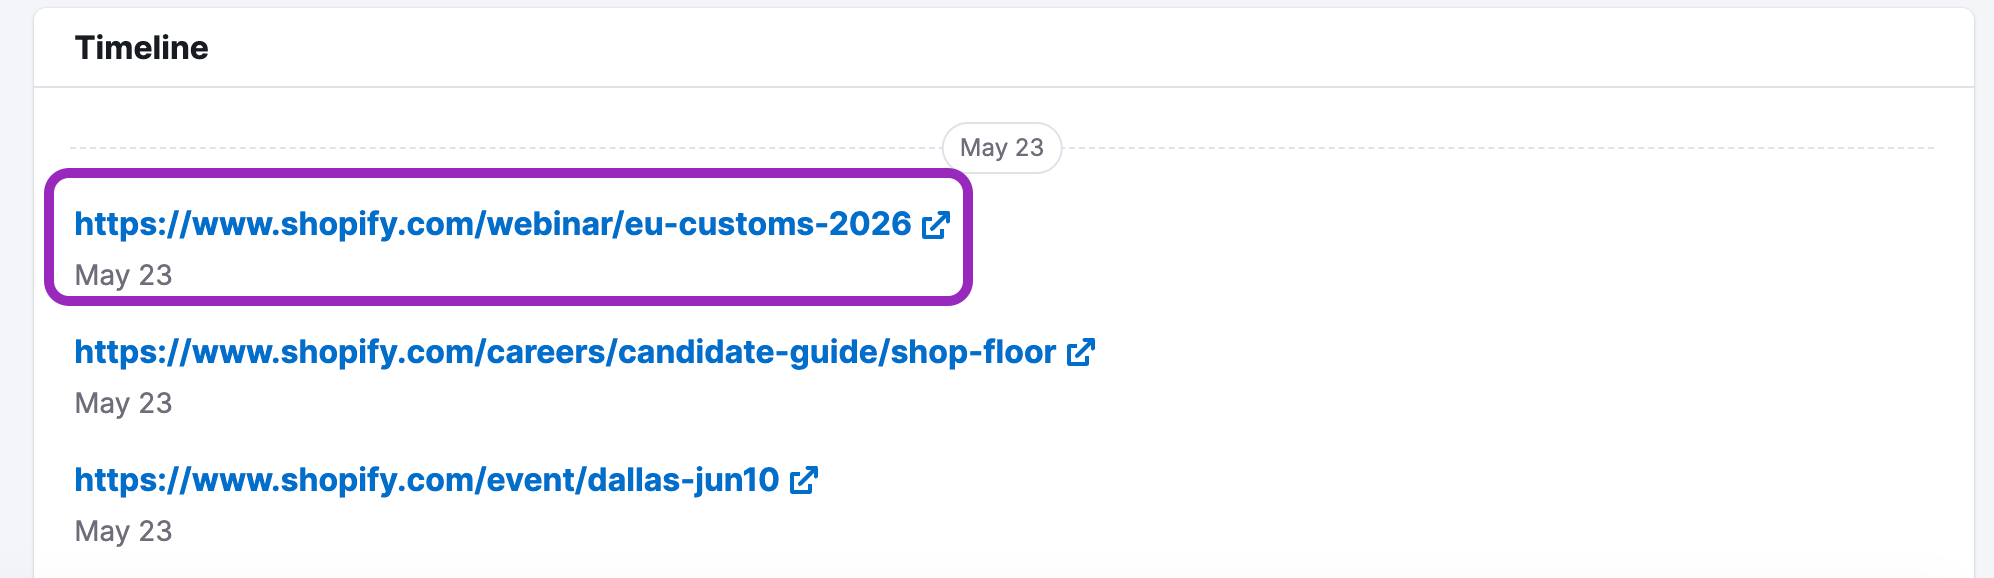
Below the trend graphs, you’ll discover the Timeline section. This section depicts the content published by the competitor over the selected period. The items shown in the timeline are determined by the selected filters and grouping chosen. To change them, you can return to the filters at the top of the page.

Each item listed in the timeline provides information and links to help you dig deeper. With Google Search Ads, the URL brings you to the landing page on the selected competitor’s website.

For Blog Post entries, the headline provides a link to the article on the selected competitor’s blog.

For New Pages, the timeline shows the appearance of any new pages on the competitor's site. With new pages, the timeline presents a link to the page, the date the page appeared, the page’s title, and a short description of the page’s content.
For Social Media, the timeline shows text previews of all posts found, the number of likes, comments, and reposts. Follow the links in the headings to see each post’s source page. You can also sort the results to check and monitor the publications of a specific social media account.

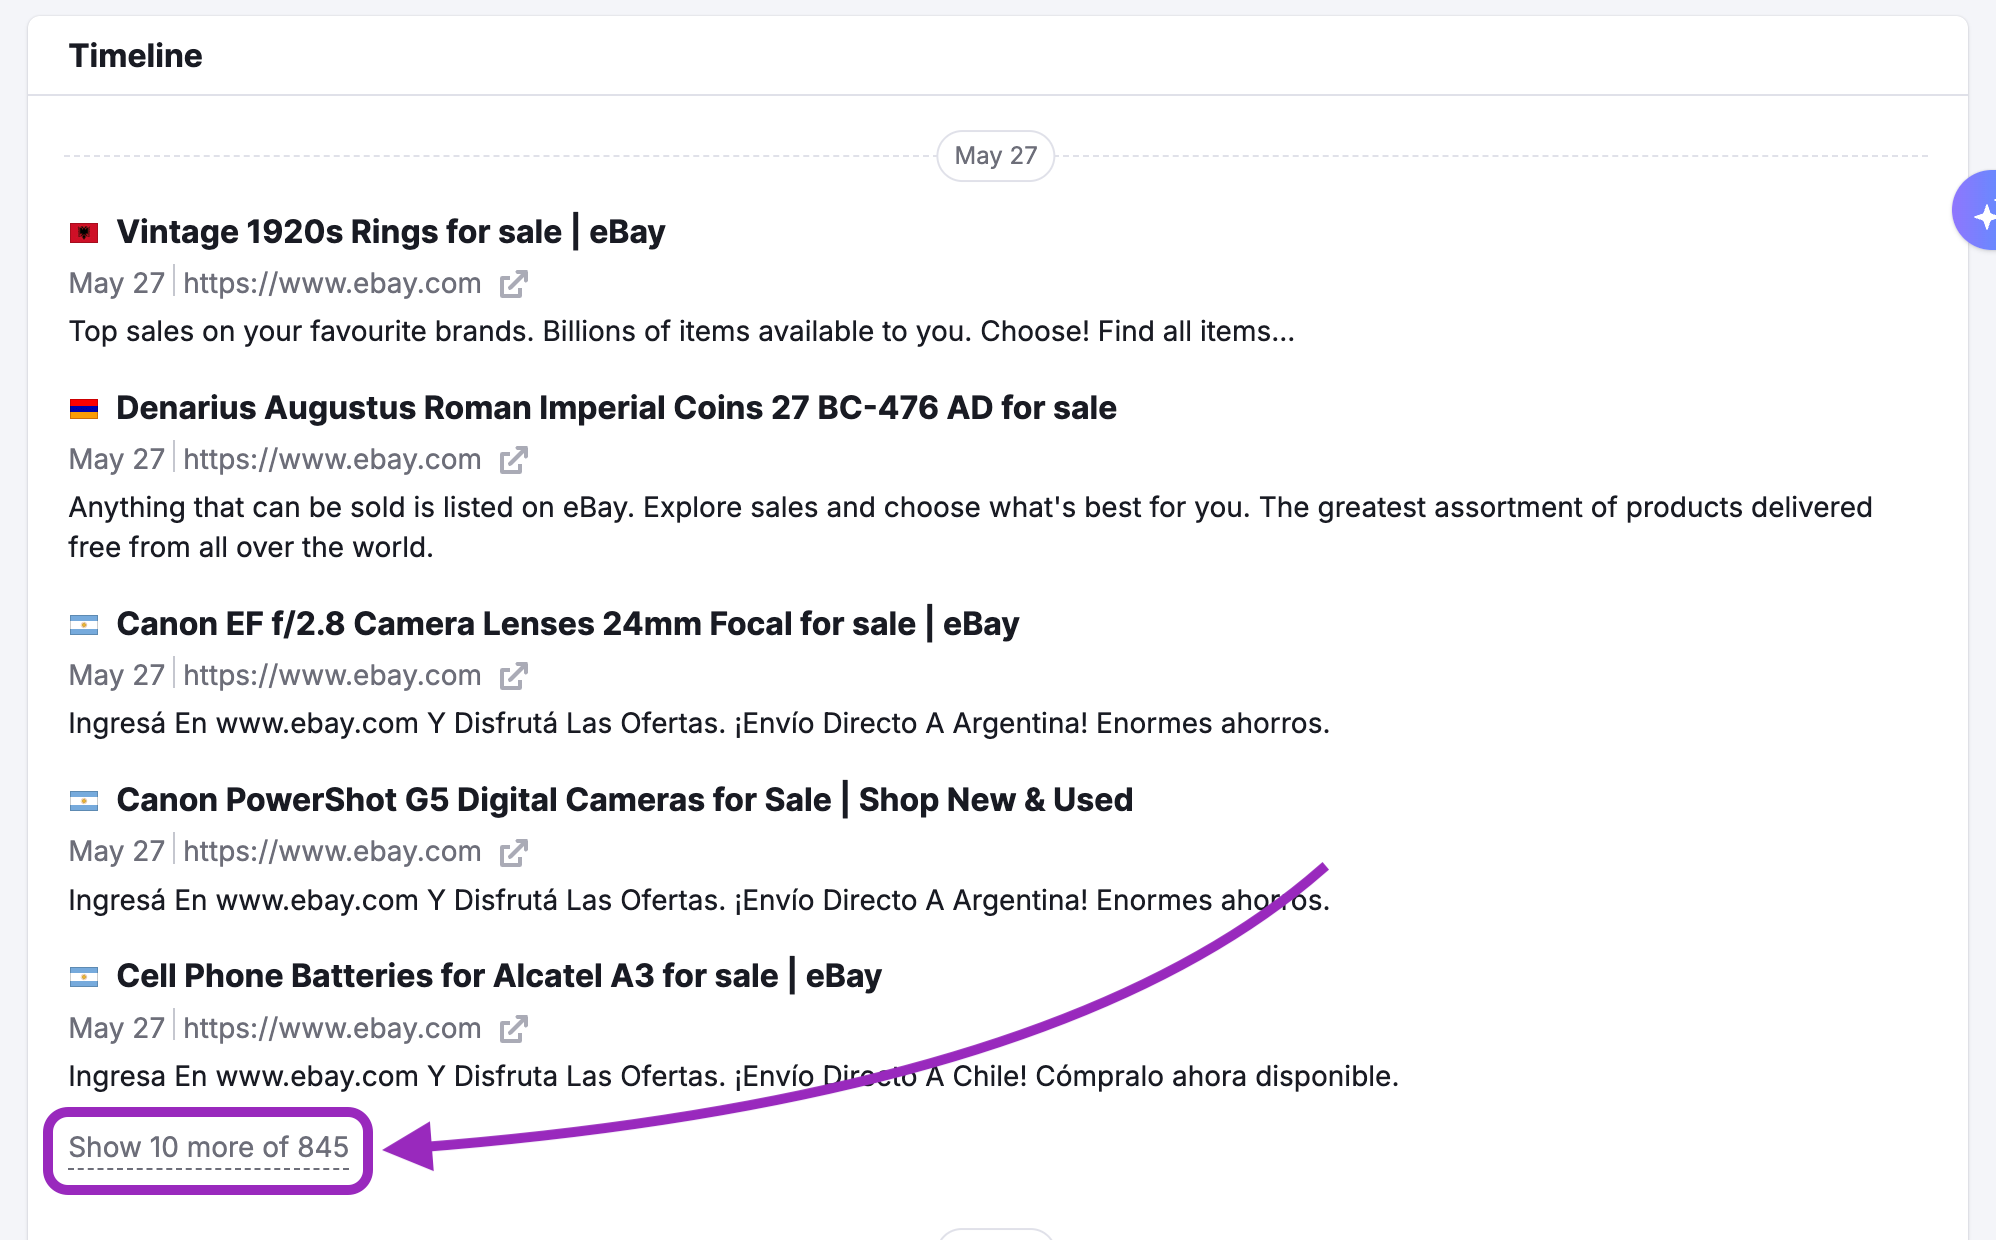
For long-term monitoring of timelines, you can hide previously opened results via the button at the end of the report:
Limits
Competitor Monitoring is available inside the Traffic & Market Toolkit. Your access to historical data, exports, and report features may depend on your subscription.
When Competitor Monitoring analyzes a competitor for the first time, it collects blog posts from the previous 4 weeks. Google Search Ads data starts from the day you add the competitor for monitoring.
Social Media data works differently. When you add a Facebook or Instagram account for monitoring, Competitor Monitoring can collect up to 30 days of historical social media data from the date the account is added.
Search ads data comes from Advertising Intelligence and follows its data collection limits. Competitor Monitoring is designed to highlight new activity from the selected competitor. If an ad has already been detected for that competitor in the past, it will not be reported as new again, even if it appears in search results later.